The Quantified Workforce
If you cannot measure your talent, you cannot manage your capacity for change.

For decades, the foundation of corporate HR was the job description. A static list of duties, tethered to a fixed title. We treated our greatest asset, the people, as fixed resources: a “Senior Analyst,” a “Marketing Manager,” a “Java Developer.”
But in an era defined by constant disruption, AI-driven change, and the need for organizational agility, this model is a potential liability. We’ve mastered qualitative. To build a truly resilient, high-performing organization, we must quantize our employee population. We must move from viewing talent as a collection of static roles to a dynamic, measurable set of vectors.
The failure to quantize talent could mean organizations are operating with an inventory of people and data that is perpetually outdated, incomplete, and fundamentally inaccurate. The solution starts as a Unified Talent Profile (UTP): a dynamic, multi-layered “digital twin” of every employee’s professional identity. Though Unified Talent Profile has a good ring to it, it doesn’t generally account for the verifiable financial maths. Therefore, let’s call the overall framework a Digital Capacity Ledger (DCL).
The core principle is simple: Every employee is a vector in a talent space. Their capability, experience, and aspiration can be represented as a set of data points, allowing us to perform quantitative, measurable operations on them.
Digital is your data asset, your twin.
Capability captures skills, experience, and potential.
Ledger is verifiability, “auditability”, and measurable value, aligning with the financial and vector math.

Building the Digital Twin and DCL
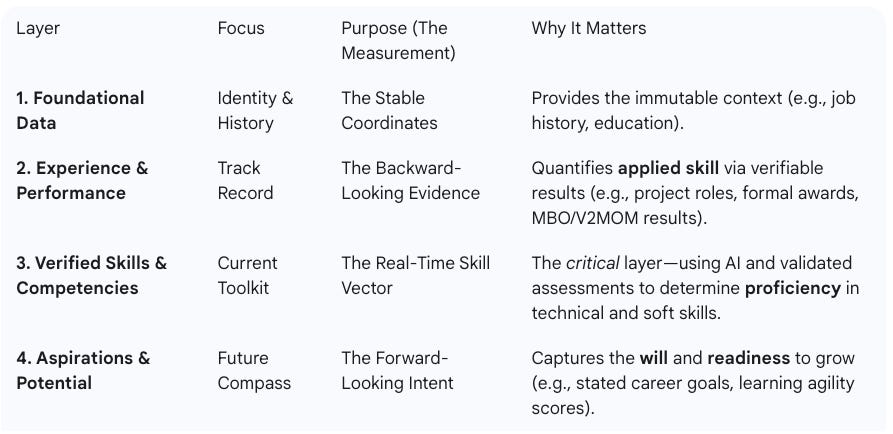
The DCL is holistic, built on four integrated data layers that remove the bias and subjectivity inherent in traditional reviews. This logical framework is the prerequisite for any math we apply.
The Mechanics of Quantification
ok this goes deep into it for math nerds. Feel free to skip to the next section with real world type examples.
The Unified Talent Profile (DCL) is an interconnected data engine. The four layers aren’t just filing cabinets; they’re stages in a process that transforms subjective experience into an objective, measurable vector. Here’s how the layers collaborate to power the math:
Step 1: Context and Validation (Layers 1 & 2 -> Layer 3)
The journey to quantification begins with validation. We can’t trust a self-declared skill level pk unless it’s grounded in verifiable action.
Layer 1 (Foundational Data) provides the metadata (like Job History and Education) that defines the context of the employee. It’s the “who” and the “where.”
Layer 2 (Experience & Performance) acts as the Validation Engine: AI and data models ingest the employee’s Track Record (project history, performance reviews, V2MOMs). For instance, a successful outcome tied to a “Python Automation Project” in the performance data validates and increases the confidence score for their Python proficiency.
Result: This process generates the reliable, objective numbers for the Employee Skill Vector (P), which lives in Layer 3. Layers 1 and 2 are the evidence streams that ensure (P) is based on verifiable performance, not just aspiration. They do not require separate math; they are the inputs that make the Layer 3 math trustworthy.
Step 2: The Core Quantification (Layer 3)
This is the central calculation stage where we establish the gap size.
Action: We compare the validated Employee Skill Vector
(P)against the Target Role Vector(R), which is derived from the requirements of the future job.Output: This direct comparison yields the Career Delta
(D)the absolute size of the skill gap and the Time-Investment Delta(DTI), which factors in the difficulty of each deficient skill.
Decision: The D and DTI metrics provide the first major economic decision point: What is the quantifiable cost of this career move?
Step 3: Predictive Modification (Layer 4-> The Formulas)
The final step is translating the “cost” into a predictable “time.”
Action: We introduce the Learning Agility Score from λ Layer 4 (Aspirations & Potential). λ is a measure of the employee’s demonstrated capacity to learn quickly (often informed by past development efforts and self-assessed readiness).
Output: λ is the modifier that acts on the
DTIscore. A large gap (DTIis high) can be offset by a high λ , resulting in a shorter time-to-readiness.Decision: This produces the Estimated Time-to-Readiness
(Test). This metric drives the final strategic decision: Is the predicted ramp-up time fast enough to justify the investment over external hiring?
By following this flow, the DCL ensures that every strategic talent decision is rooted in validated experience (Layers 1 & 2), measured with mathematical precision (Layer 3), and prioritized based on employee intent and potential (Layer 4).
Vector for the Career Delta
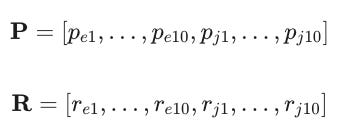
By digitizing talent (Layer 3), we treat both the Employee and the Target Role as 20-dimensional vectors in a skill space (10 Global Skills + 10 Job-Specific Skills), each measured on a proficiency scale (lets use 0 to 5).
1. Defining the Skill Vectors
The Employee Skill Vector (P) and the Target Role Vector (R) are constructed from the verified proficiency scores (p) and required proficiency scores (r).
2. Calculating the Total Career Delta (D)
The Career Delta is the measurable skills gap : the “straight-line” distance between the employee’s current skills and the target role’s requirements. We use the Euclidean Distance (D) to quantify this gap.
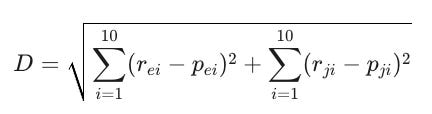
Interpretation: A smaller Euclidean Distance (D) means the employee is a closer, more immediate fit. Larger distances equal less fit.
3. Quantifying Time and Investment (The Weighted Delta)
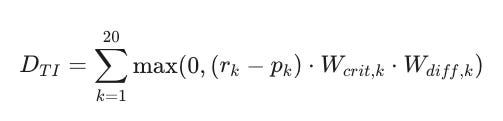
We apply a Skill Criticality Weight (Wcrit) and a Learning Difficulty Weight (Wdiff) only to skills where a deficit exists (rk > pk) to get the true development load.
The Time-Investment Delta (DTI) for the total development load is the sum of these weighted gaps:
4. The Estimated Time-to-Readiness

We incorporate the employee’s proven capacity to acquire new skills : the Learning Agility Score λ from Layer 4. This provides the ultimate prediction of the ramp-up time.
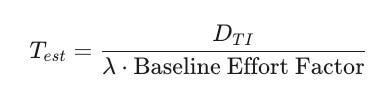
Interpretation:
Test provides a data-driven prediction of how long it will take the employee to be job-ready.

Real-World type Examples: The Polarity of the Delta
We examine three different scenarios, all aiming for critical roles. We use a theoretical financial cost of $15,000 per weighted unit of DTI for training, mentorship, and lost productivity. The cost of an external hire is estimated at $40,000 (recruitment fees, sign-on bonus, and typical ramp-up costs).
Case 1: The Polar Distance—Recruiter to Software Engineer
Employee Profile: Jane, a Senior Recruiter
Jane has no professional technical experience. Her DCL (Layer 3) shows low proficiency in all 10 Job-Specific skills. Her Learning Agility (λ) is high (1.2), but the initial gap is vast. I love testing extreme examples to see if the math holds up.
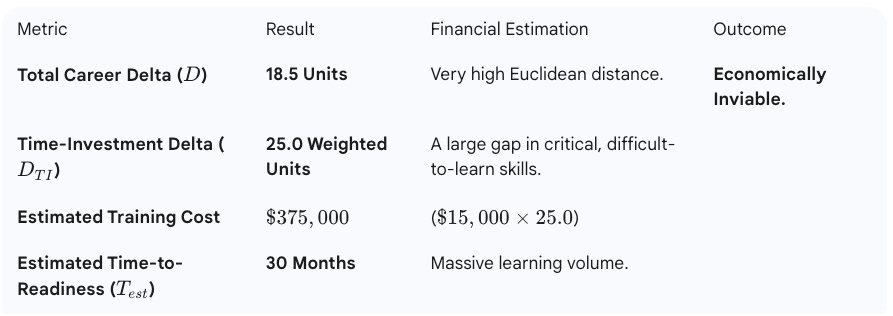
Analysis: The quantified cost of upskilling Jane is nearly ten times the cost of an external hire, and the time-to-readiness is unacceptable. The DCL proves the distance is too great; the ROI is negative.
Case 2: The Actionable Distance—DevOps Engineer to Software Engineer
Employee Profile: Mark, a Senior DevOps Engineer
Mark is proficient in infrastructure-as-code and deployment pipelines. His DCL (Layer 3) shows high proficiency in adjacent skills (e.g., Python, Cloud). His Learning Agility (λ) is exceptional (1.4).
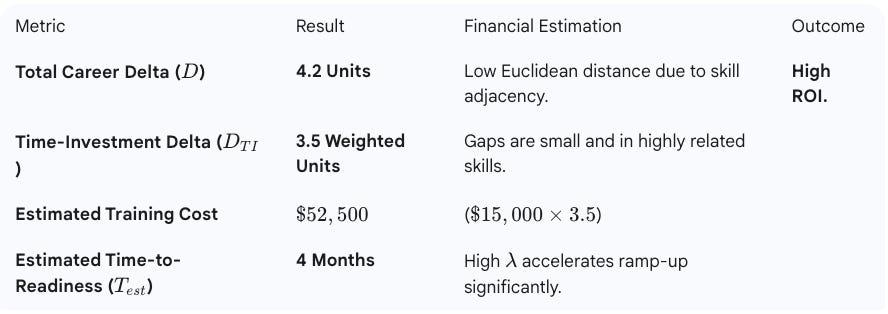
Analysis: The internal transition cost is marginally higher than the external hire cost $40,000, but the 4-month time-to-readiness is significantly faster. Mark also retains valuable institutional knowledge, justifying the spend.
Case 3: The Strategic Retooling—Customer Support Managers to AI Orchestrators
Team Profile: 10 Customer Support Managers (CSMs)
The goal is to transform 10 CSMs into 8 AI Customer Support Orchestrators (CSO) to support a new low-code AI chatbot platform. The new role requires core management skills (high pe) but adds new skills: “AI Platform Configuration” and “Prompt Engineering.”
Analysis for the Average CSM
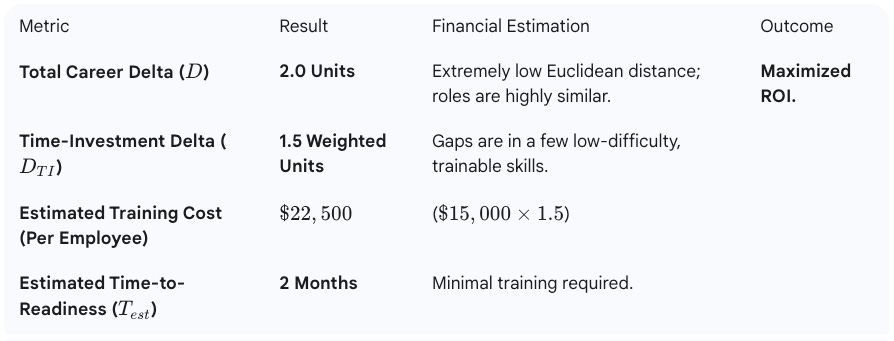
Financial Analysis & Outcome:
Conclusion: The DCL quantifies that this team transformation is a massive win. The low Career Delta and fast Test confirm the viability. By proactively training 8 people and eliminating 2 redundant roles, the organization achieves cost avoidance while gaining the strategic capability needed for the future. This transition is a high-confidence, quantifiable success.

Change
The shift from jobs to people is non-negotiable for business survival. Organizations that can accurately measure and rapidly re-deploy their internal talent will be the winners of the next decade.
Quantifying the employee population is not about reducing people to numbers; it’s about unlocking their full, dynamic potential with precision and transparency. It’s about building a data-driven system where the path to growth is clear, efficient, and equally beneficial for the individual and the enterprise.
Disruption to Performance and Compensation
Before diving too deep: Performance and Compensation are compliant heavy endeavors. This is merely a thought exercise. I care deeply about nullifying biases whenever possible.
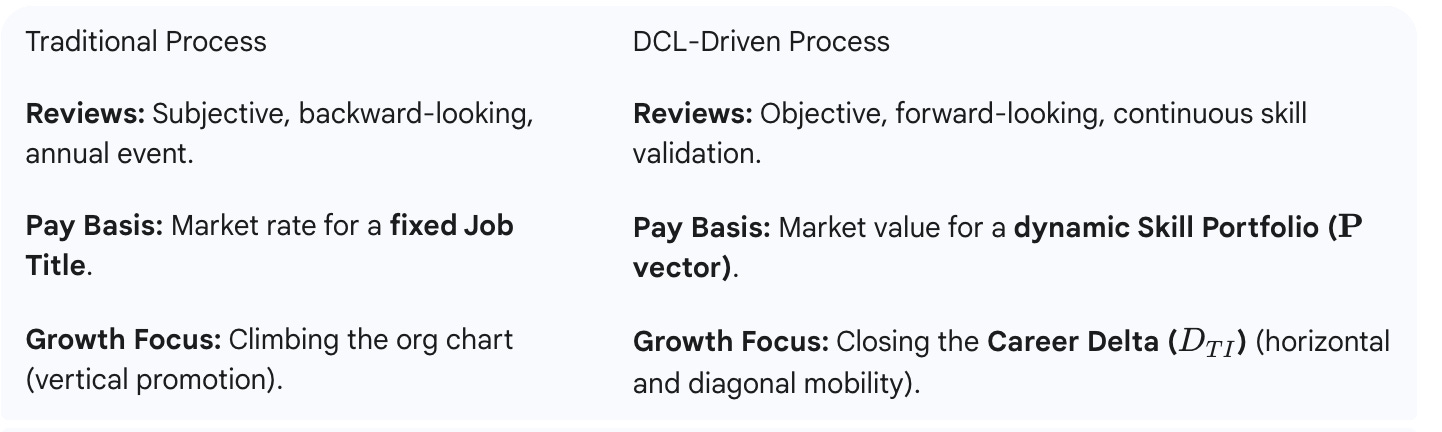
The traditional processes for performance review and compensation are evolving because they currently rely on subjective memory and static job titles. The Digital Capacity Layer (DCL) eliminates this by introducing continuous, objective, and skills-based metrics.
1. Revolutionizing Performance Reviews
Traditional performance reviews are often backward-looking, focused on fixed goals, and prone to recency bias. The DCL transforms the review into a forward-looking, data-driven career planning session.
From Subjectivity to Data: The Layer 2 (Experience & Performance) data is no longer a manager’s subjective rating; it’s an aggregation of quantifiable project contributions, verifiable accomplishments, and outcome results. This continuous data feed provides a 360-degree, objective view of applied skills.
From Titles to Vectors: The review shifts from “How well did you perform the duties of a Marketing Manager?” to “How did your current Skill Vector evolve this quarter, and how much did your Learning Agility score improve?”
Continuous Skill Validation: Performance assessment becomes an ongoing process of validating and updating Layer 3 (Verified Skills). Did the employee use the new cloud security skill? If yes, their proficiency score is confirmed, making the review a formal acknowledgment of objective growth.
2. Overhauling Compensation and Rewards
Compensation traditionally revolves around the market rate for a job title, penalizing individuals whose skills outgrow their current box. The DCL connects pay to the quantifiable value of an individual’s unique skill portfolio and their ability to acquire critical skills.
Pay for Skills, Not Just Titles: Compensation is tied directly to the Verified Skill Vector (P), particularly proficiency in high-demand, high-criticality skills (those with a high Wcrit factor . An employee with Ppython = 5 and Pcloud = 4 is paid a premium over another employee in the same job title with lower proficiency scores, regardless of their current title (again, massive compliance risk, just a thought exercise).
Rewarding Mobility and Agility: The system incentivizes closing the Career Delta. When an employee successfully transitions to a new role, their compensation adjustment is directly proportional to the change in their (P) vector and the market value of the new skill set. Furthermore, a consistently high Learning Agility λ. score can be used as a measurable component in bonus calculations, rewarding the capacity for future value creation.
Transparency and Fairness: By tying pay to objective, measurable skills (Layer 3) and validated experience (Layer 2), the DCL dramatically reduces the potential for bias often seen in subjective performance reviews. It creates a transparent skills-based salary band that employees can navigate by quantifiably improving their own (P) vector (big ifs here, but still, what if?).
The DCL transforms HR from an administrative function into a data-driven investment office, where every dollar spent on development or compensation is justified by a measurable increase in organizational capability.
If you cannot measure your talent, you cannot manage your capacity for change.